Financial series
This post brings a quick overview of financial series in R. It’s common analyze time series in advanced economics or finance courses. Some courses and depending of university use a particular software for this purpose, from Excel to high-level programming languages like Stata, R or Python. In this case, I’m going to show how to get the financial series from Yahoo Finance by two methods. First, I’ll do it within a long code using quantmond library, after that I gonna use tidyquant library to reduce the previous code and automatize it.
In order to manipulate our data we gonna call dplyr and quantmod to get the financial series. Let’s begin with four stocks: Google, Apple, Facebook and Amazon.
library(dplyr)
library(quantmod)
The function getSymbols from quantmod is a useful tool that brings our stocks from Yahoo sources. There are some parameters in the function like Symbols, env, return.class, from, to, periodicity that can be change.
Symbols: there are a lot of stock stickers visible on Yahoo finance page.
Stickers: “FB”, “GOOG”,“AAPL”,“AMZN”.
xts: in return.class is a way to get time series object.
from and to: are filled with a range of dates.
periodicity: could be yearly, quarterly or monthly.
In this example, get all stocks means to repeat the process four times.
getSymbols.yahoo(Symbols = "FB", env = globalenv(), return.class = "xts", from = "2020-01-30", to = "2020-12-22",periodicity = "weekly")## [1] "FB" getSymbols.yahoo(Symbols = "GOOG", env = globalenv(), return.class = "xts", from = "2020-01-30", to = "2020-12-22",periodicity = "weekly")## [1] "GOOG" getSymbols.yahoo(Symbols = "AAPL", env = globalenv(), return.class = "xts", from = "2020-01-30", to = "2020-12-22",periodicity = "weekly")## [1] "AAPL"getSymbols.yahoo(Symbols = "AMZN", env = globalenv(), return.class = "xts", from = "2020-01-30", to = "2020-12-22",periodicity = "weekly")## [1] "AMZN"The result of use getSymbols is an xts object with six columns: Open, High, Low, Close, Volume and adjusted.
head(FB,10)## FB.Open FB.High FB.Low FB.Close FB.Volume FB.Adjusted
## 2020-01-27 221.44 224.20 201.06 201.91 113316700 201.91
## 2020-02-03 203.44 212.82 202.50 212.33 70472700 212.33
## 2020-02-10 211.52 214.93 206.51 214.18 76839200 214.18
## 2020-02-17 213.55 218.77 208.83 210.18 54945800 210.18
## 2020-02-24 201.80 203.65 181.82 192.47 115289600 192.47
## 2020-03-02 194.03 197.24 176.26 181.09 119888600 181.09
## 2020-03-09 169.60 178.29 154.34 170.28 153135600 170.28
## 2020-03-16 152.32 159.93 137.10 149.73 183359800 149.73
## 2020-03-23 149.66 164.00 142.25 156.79 146892200 156.79
## 2020-03-30 159.18 170.93 150.83 154.18 112568700 154.18The second way to do this process more efficient and short is using tidyquant library. The library has some functions incorporate in order to minimize code extension. One of those function is tq_get, really helpful for bring a numerous of stocks. tq_transmute gets stock returns with a daily periodicity and pivot_wider is increasing the number of columns and decreasing the number of rows.
library("tidyquant")
library("timetk")
library(tidyr)

stickers<- c("FB", "AMZN","GOOG","AAPL")

p_adj<- stickers %>%
  tq_get(  from = '2019-01-31',
           to = '2019-12-30',
           get = 'stock.prices') %>%
  group_by(symbol) %>%
  tq_transmute(select = adjusted,
               mutate_fun = to.period,
               period= "days", )  %>%
  pivot_wider(names_from  = symbol, values_from = adjusted) %>%
  tk_xts()
head(p_adj,10) ## FB AMZN GOOG AAPL
## 2019-01-31 166.69 1718.73 1116.37 40.51361
## 2019-02-01 165.71 1626.23 1110.75 40.53309
## 2019-02-04 169.25 1633.31 1132.80 41.68442
## 2019-02-05 171.16 1658.81 1145.99 42.39762
## 2019-02-06 170.49 1640.26 1115.23 42.41223
## 2019-02-07 166.38 1614.37 1098.71 41.60897
## 2019-02-08 167.33 1588.22 1095.06 41.65786
## 2019-02-11 165.79 1591.00 1095.01 41.41829
## 2019-02-12 165.04 1638.01 1121.37 41.77520
## 2019-02-13 164.07 1640.00 1120.16 41.60163Finally a good way to finish this post is visualizing our data.
quantmod::chart_Series(FB$FB.Adjusted, name = "FB Adjusted Price")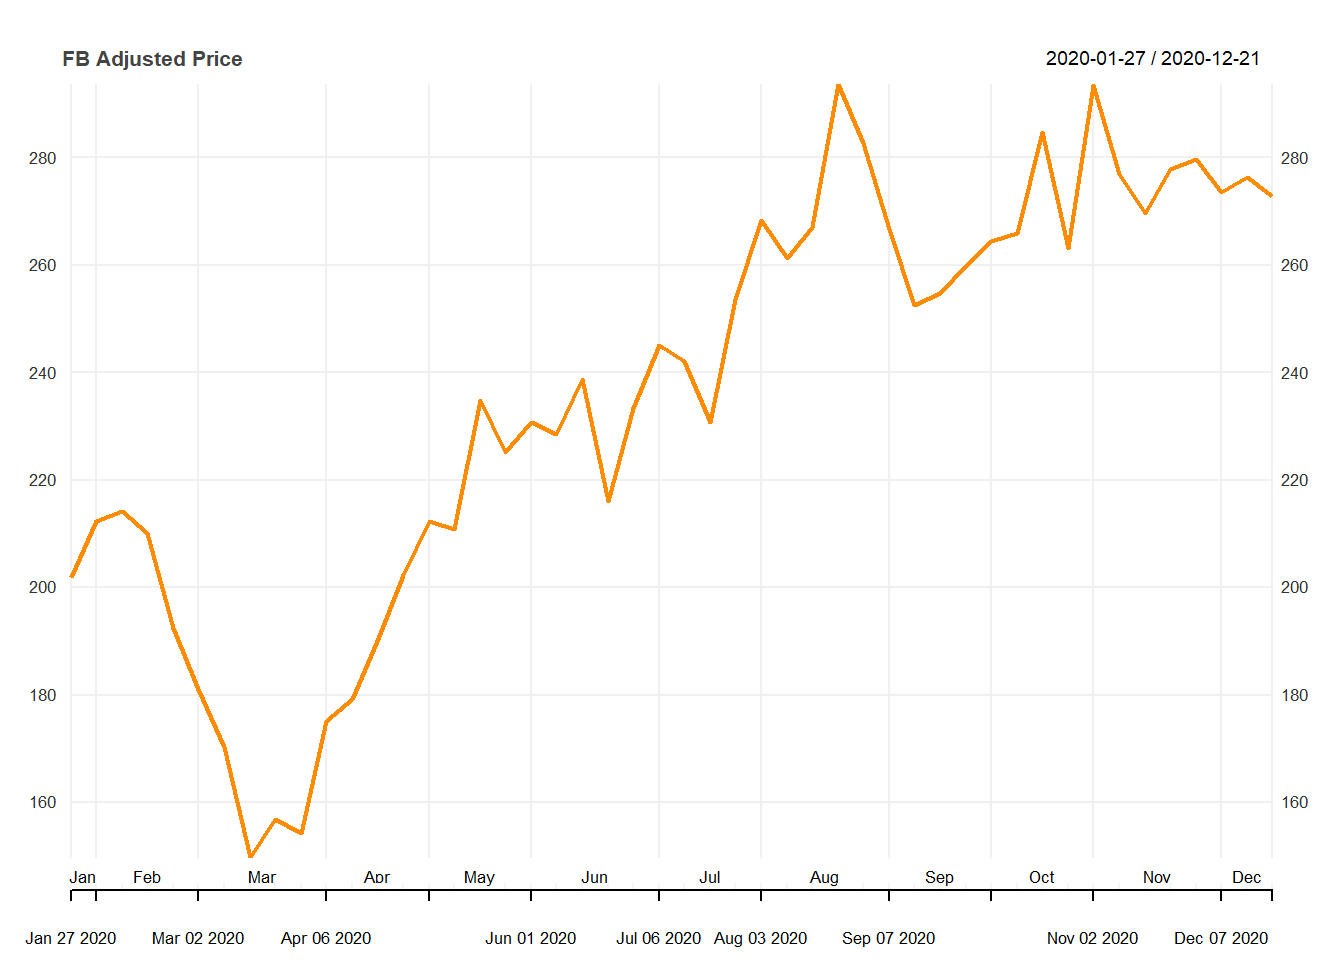
quantmod::chart_Series(p_adj$AAPL, name="Apple Adjusted Price")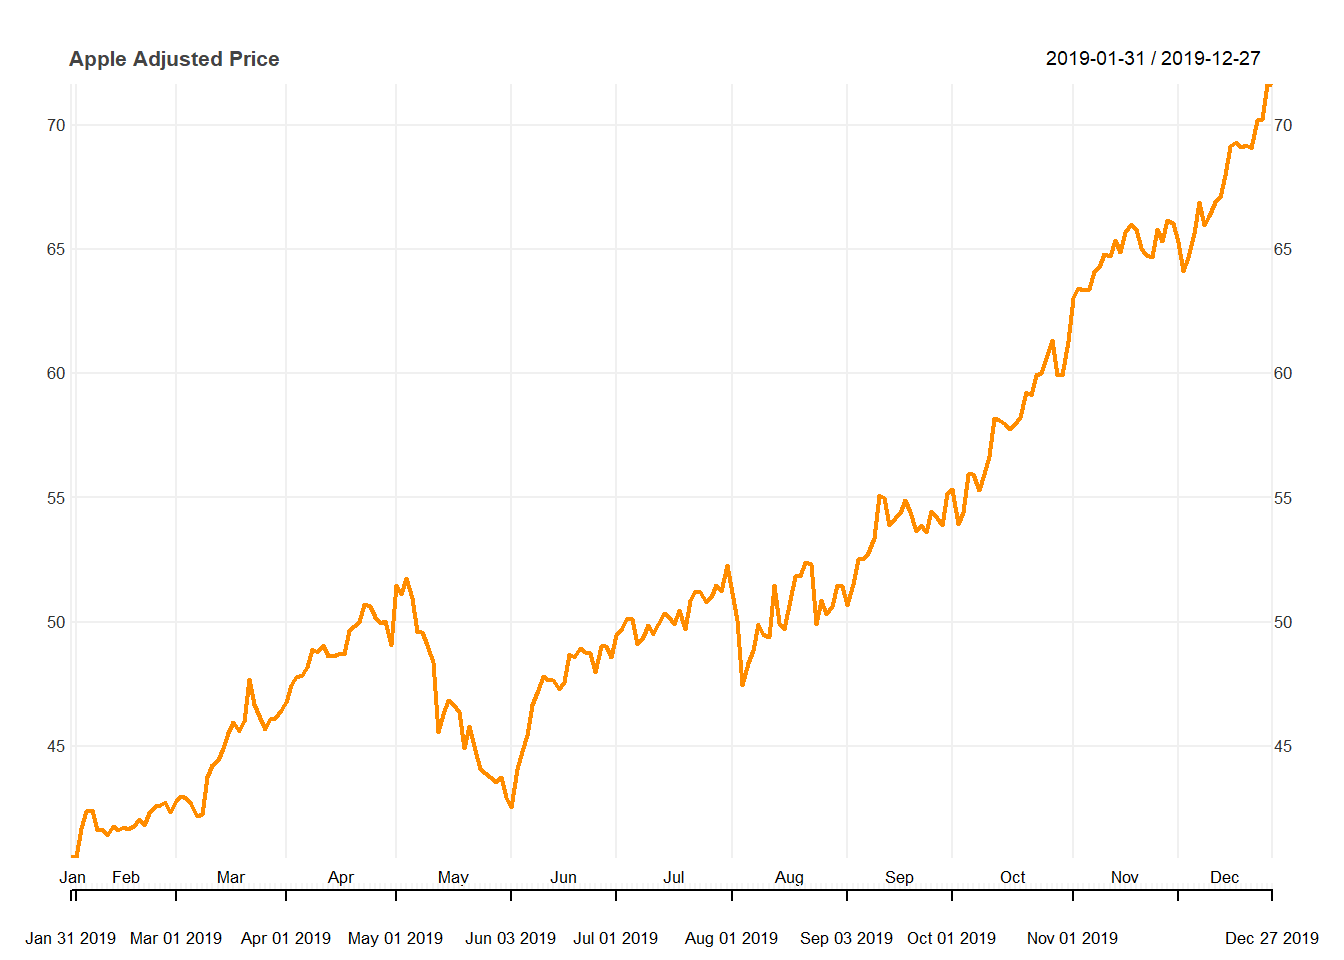
In this post we learned ways to get financial time series from yahoo finance using quantmod and tidyquant. We saw quantmod functions like getSymbols and tq_get of tidyquant library, in one hand getSymbols brought an xts object in an easily but inefficient manner, and the other hand we automatized it with tq_get that brought us an amount of series efficiently.